Student Debt Per Capita in the States

According to the Federal Reserve Bank of New York, for the last quarter of 2023 average student debt per capita in the United States was $5635. The District of Columbia far surpassed all the other states with an average student debt per capita of $12,900!  The next highest student debt per capita averages were found in Maryland and Georgia at over $7,000. The states with the lowest student debt per capita were Wyoming, Hawaii, and New Mexico.  Should taxpayers in those states subsidize people in states with higher student debt per capita?

The data shown here is the average outstanding student debt per capita in the states for the fourth quarter of the year given.  According to the Federal Reserve Bank of New York, the data is collected as follows: "The FRBNY Consumer Credit Panel consists of detailed Equifax credit-report data for a unique longitudinal quarterly panel of individuals and households from 1999 to 2012. The panel is a nationally representative 5% random sample of all individuals with a social security number and a credit report (usually aged 19 and over). We also sampled all other individuals living at the same address as the primary sample members, allowing us to track household-level credit and debt for a random sample of US households."

  READ MORE

2024 Five Bottom Sinkhole Cities

TIA's newest Financial State of the Cities came out on February 15, 2024.  This comprehensive analysis of the most populous U.S. cities includes the most up-to-date city finance and pension data, trends across the cities, and key findings. The report is based on each city's audited Annual Comprehensive Financial Report and retirement plans’ reports.

  READ MORE

# of governments

Local Government Units in States

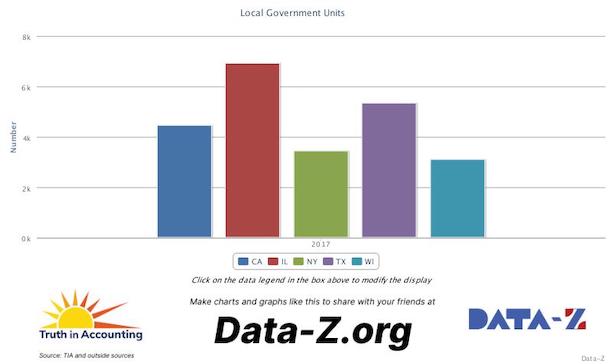
For 2022 the U.S. Census Bureau reported the number of local governments in all the states.  As to be expected the smallest states had the fewest local governments.  However, the states with the most local government units were not necessarily the largest.  Illinois led the pack with  6930 units which was almost 1400 more than Texas (5533) which has nearly three times Illinois's population, and was over three times the average number of local government units (1781) for the entire country.  READ MORE

Bachelor's Degree Median Income in Cities

For students graduating soon, it might be worth looking at the median income for people with a bachelor's degree only in different cities.  In 2022, the highest median income of the population aged 25 or older in the city whose highest degree attained is a bachelor’s degree was in San Francisco at  $106,552.  That is much higher than in other major cities, such as Chicago ($72,970), New York ($73,669) and Dallas ($76,127), and the national average of $64,572.   For information about median earnings for men and women by education in the 75 largest cities check out our interactive database at Data.Z.org

READ MORE

New Jersey Rankings

New Jersey has ranked 50th (dead last) in TIA's Financial State of the States Ranking for the last nine years. That means it had the worst Taxpayer Burden of all the states.  It garnered that same ranking on the Tax Foundation's Business Tax Climate Ranking.  Nevertheless, New Jersey ranked 43rd in net migration per 1000 citizens, which means only six other states lost more citizens per 1000. New Jersey did rank number one in some statistics, namely:  the highest revenue from property taxes and the highest percent of outbound moving shipments as reported by United Van Lines.  Are these things connected?  You decide!  READ MORE

Utah ranks high not only in its Taxpayer Surplus

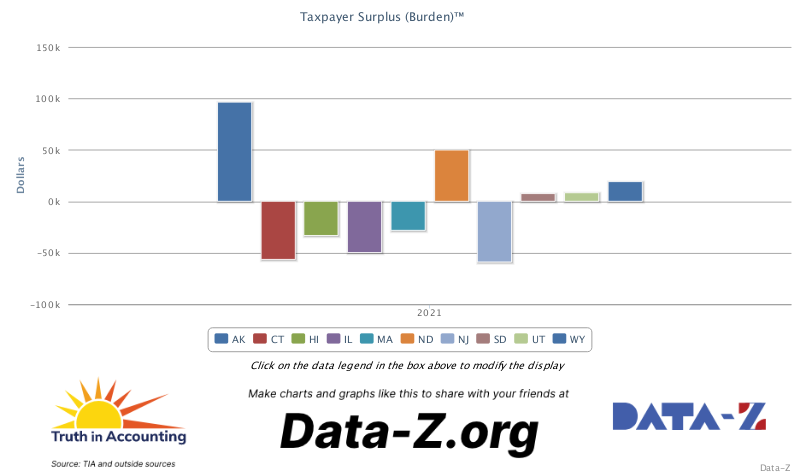
TIA ranks Utah among the top five states for its government finances.  For the last 14 years, it has maintained a taxpayer surplus according to our analysis.  You can read the report here

But Utah ranks high in many other metrics as well.  For example, it has the highest percentage of married couple households, the highest percentage of population between the ages of 1-19, and the third highest in real median household income. It also has the lowest median age of all 50 states and the second-lowest percentage of children in poverty.  To find out how Utah fares on many other demographic, economic and state financial metrics go to Data-Z.org.  You can also learn about all the other states and how they compare.  READ MORE

Are state governments the new Zombies?

For 2022 the five scariest Zombies were Delaware (46), Massachusetts (47), Connecticut (48) Illinois (49), and New Jersey (50). 

Professor Edward Kane coined the term "Zombie Bank" for banks unable to pay their debts but using untruthful accounting to stay alive.  Zombie banks "gamble for resurrection" and take large risks.  Are state and local governments the new Zombies? Truth in Accounting's Zombie Index identifies states possibly gambling for resurrection. States with higher Zombie Index rankings deserve scrutiny of the risks in their investments for public pension plans. The Zombie Index Ranking is from 1-50, with one indicating the smallest Zombie, and 50 indicating the largest Zombie

   READ MORE

State Immigration Status

The four states with the highest percentage of immigrants might surprise you. These top four states all had percentages over 20 percent:  California (26.64), New Jersey (23.04), New York (22.32), and Florida (21.16). The national average for all states is just 9.41 percent which is over one percent higher than it was in 2006. In 2021 West Virginia and Wyoming had the lowest percentage of immigrants, with 1.6 and 3.4 percent respectively.  These percentages are for foreign-born residents, including both naturalized and non-citizens.  READ MORE

Medicaid Spending Rose Nearly 10% in 2021

In 2021 the average increase in state Medicaid spending per capita across the country was 9.53 percent.  Only three states–Delaware, Tennessee, and Wyoming–saw a reduction in Medicaid spending, while four states increased per capita Medicaid spending by over 20 percent.  Those four states were Arizona, Illinois, Kentucky, and Nebraska, which increased spending by over 32 percent.  In Illinois, the increase could be related to a decrease in population, since the state lost 11 persons per 1000 residents in 2021.

   READ MORE

Unemployment in top 75 cities nearly back to pre-Covid levels

The average unemployment rate in the top 75 cities fell by almost two percentage points, from 5.4 percent in 2021 to 3.6 percent in 2022 which is comparable to the average unemployment rate in 2019. The average in 2020 was 8.8 percent. The cities with the highest unemployment rate in 2022 were Stockton, Henderson, Las Vegas, Fresno and Bakersfield according to the U.S. Bureau of Labor StatisticsREAD MORE

Previous Charts >>