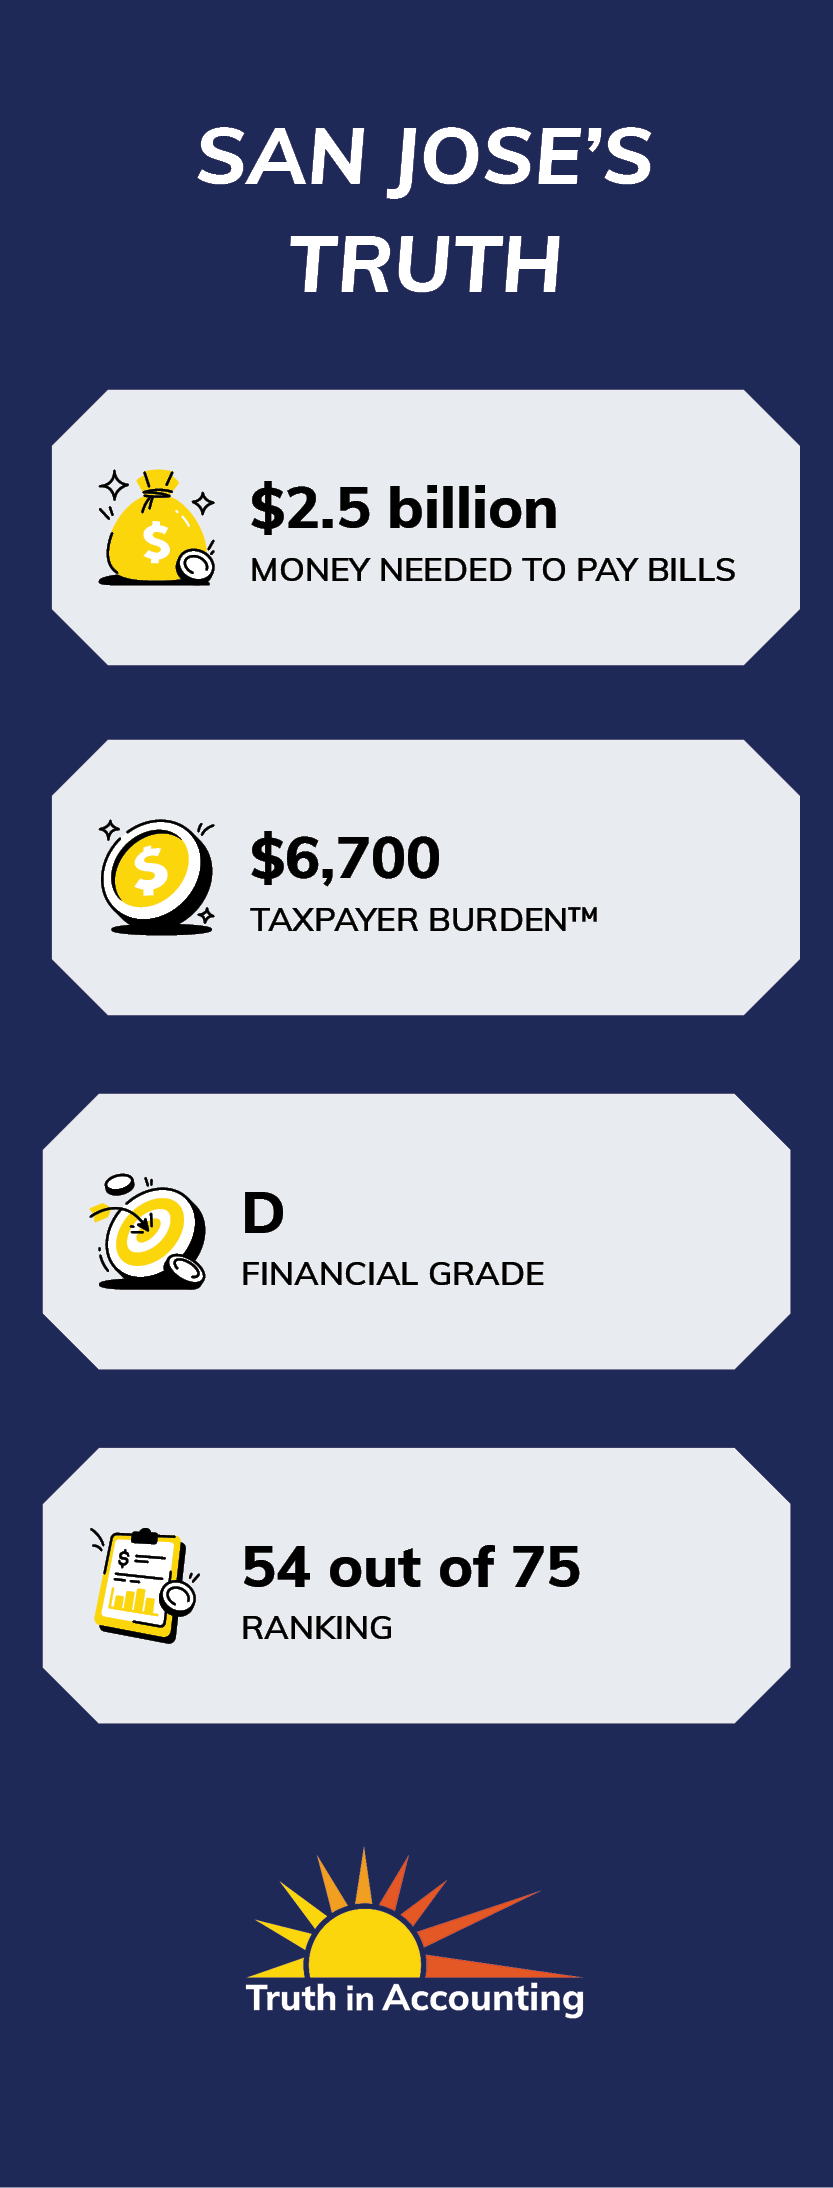
San Jose, CA

TIA Data

2022 Financial State of San Jose (Released 2/15/2024)

Use Create Your Own City Chart to see additional financial, demographic and economic data for this and other cities

 
San Jose owes more than it owns.
San Jose's Taxpayer Burden™ is -$8,700, and it received a "D" from TIA.
San Jose is a Sinkhole City without enough assets to cover its debt.
Decisions by elected officials have created a Taxpayer Burden™, which is each taxpayer's share of city bills after its available assets have been tapped.
TIA's Taxpayer Burden™ measurement incorporates all assets and liabilities, including retirement obligations.
San Jose only has $2.5 billion of assets available to pay bills totaling $5.4 billion.
Because San Jose doesn't have enough money to pay its bills, it has a -$2.9 billion financial hole. To erase this shortfall, each San Jose taxpayer would have to send -$8,700 to the city.
San Jose's reported net position is understated by $340.7 million, largely because the city defers recognizing gains resulting from decreases in retirement liabilities.
The city's financial report was released 140 days after its fiscal year end, which is considered timely according to the 180 day standard.
 

Prior Years' TIA Data

2021 San Jose Combined Taxpayer Burden

2021 Financial State of San Jose

2020 San Jose Combined Taxpayer Burden

2020 Financial State of San Jose

2019 San Jose Combined Taxpayer Burden

2019 Financial State of San Jose

2018 San Jose Combined Taxpayer Burden

2018 Financial State of San Jose

2017 San Jose Combined Taxpayer Burden

2017 Financial State of San Jose

2016 San Jose Combined Taxpayer Burden

2016 Financial State of San Jose

2015 Financial State of San Jose

2014 Financial State of San Jose

Other Resources

San Jose Annual Comprehensive Financial Reports

Publishing Entity: Finance Department

IN THE NEWS
VIEW LESS