Oregon

TIA Data

2023 Financial State of Oregon (Released 10/03/2024)

Use Create Your Own State Chart to see additional financial, demographic and economic data for this and other states

 
Oregon owns more than it owes.
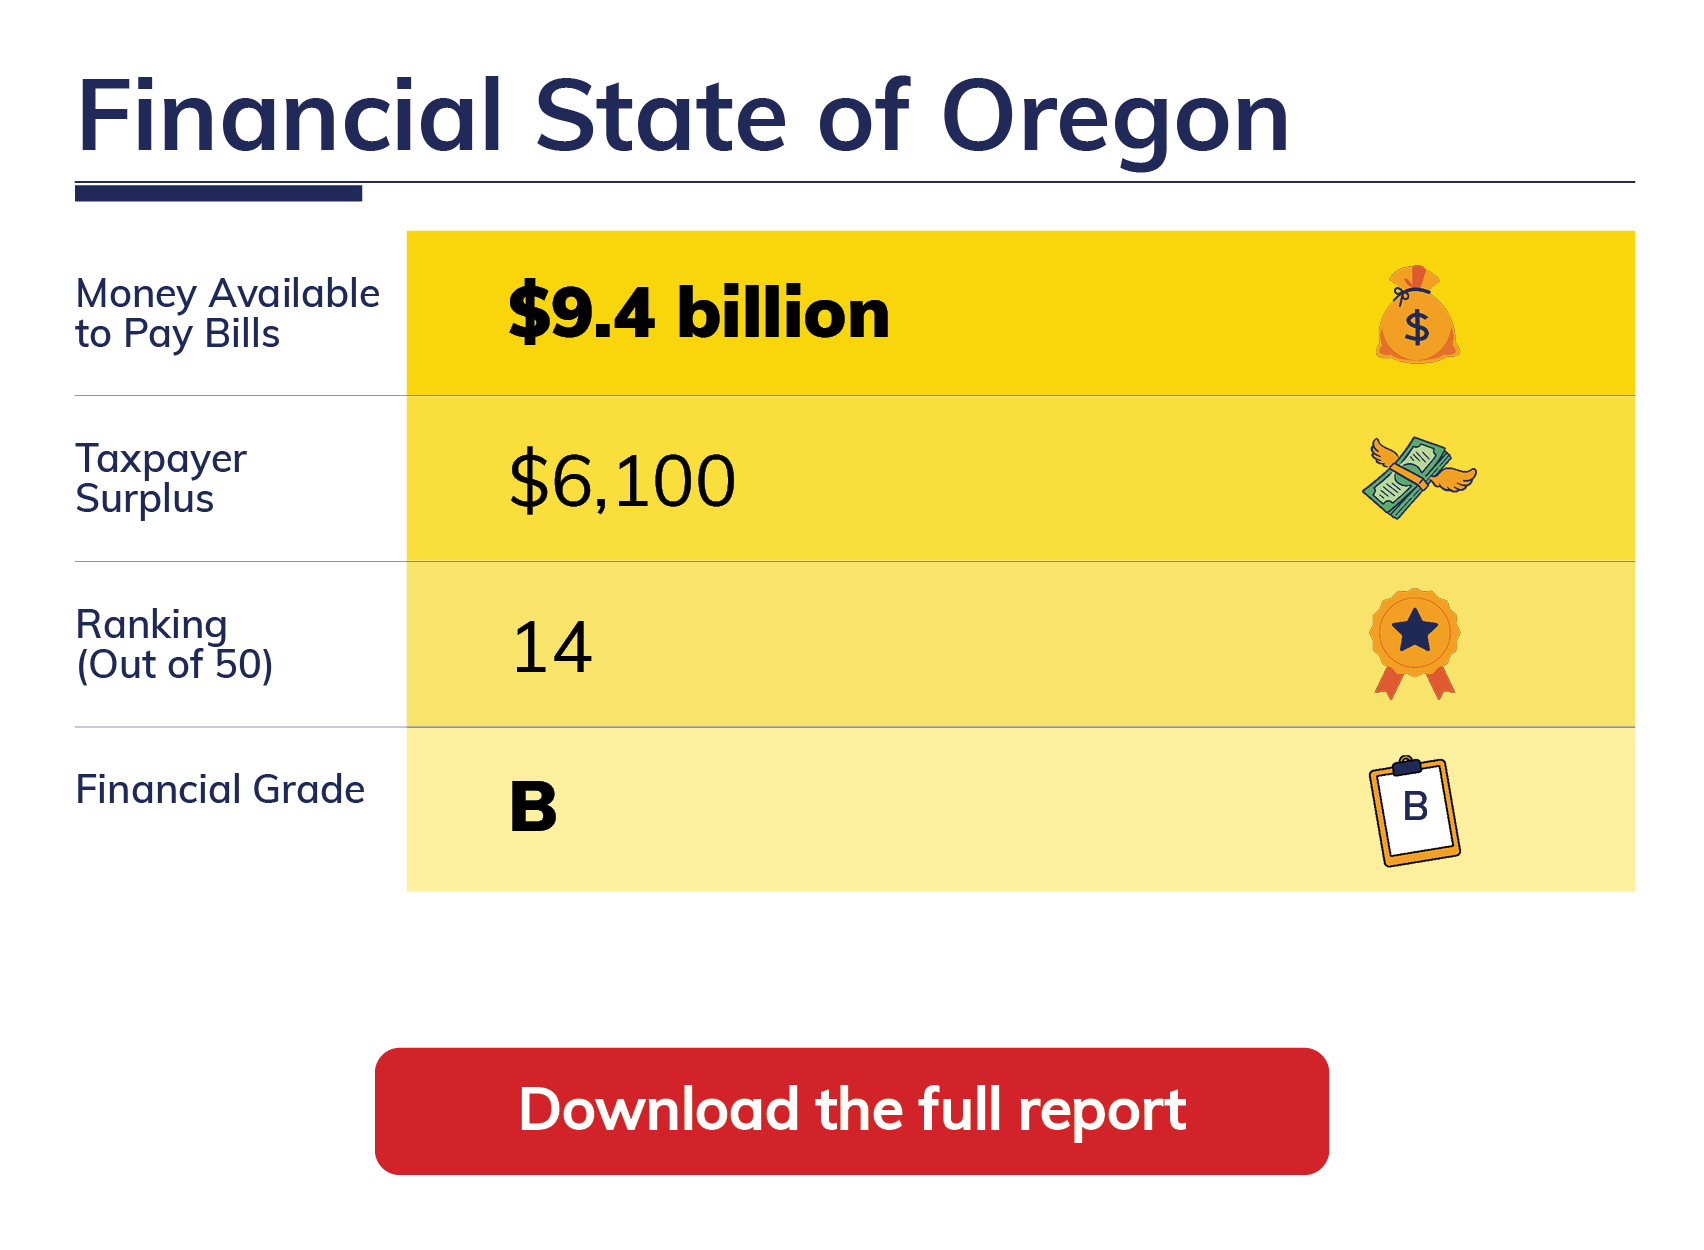
Oregon has a $8,500 Taxpayer Surplus.™
Oregon is a Sunshine State with enough assets to cover its debt.
Elected officials have created a Taxpayer Surplus™, which is each taxpayer's share of money available after state bills have been paid.
TIA's Taxpayer Surplus™ measurement incorporates both assets and liabilities, not just pension debt.
Oregon has $42 billion of assets available to pay the state's bills totaling $28.2 billion.
Oregon has $13.8 billion available after bills have been paid, which breaks down to $8,500 per taxpayer.
Oregon's reported net position is overstated by $794.9 million, largely because the state delays recognizing losses incurred when the net pension liability increases.
The state's financial report was released 203 days after its fiscal year end, which is considered untimely according to the 180 day standard.
 

Prior Years' TIA Data

2022 Financial State of Oregon

2021 Financial State of Oregon

2020 Financial State of Oregon

2019 Financial State of Oregon

2018 Financial State of Oregon

2017 Financial State of Oregon

2016 Financial State of Oregon

2015 Financial State of Oregon

2014 Financial State of Oregon

2013 Financial State of Oregon

2012 Financial State of Oregon

2011 Financial State of Oregon

2010 Financial State of Oregon

2009 Financial State of Oregon

City and Other Municipal Reports

Financial State of Portland

Other Resources

Oregon Annual Comprehensive Financial Reports

Publishing Entity: Accounting and Reporting Services

SNAPSHOT BY THE NUMBERS
  • Oregon's Assets Exceed Its Bills
  • Assets * $81.4
  • Less: Capital Assets * $25.7
  • Restricted Assets * $13.7
  • Assets Available to Pay Bills * $42
  • Less: Bills * $28.2
  • Money Available (Needed) to Pay Bills * $13.8
  • Each Taxpayer's Surplus (Burden) $8,500
  • The Bills Oregon has Accumulated
  • State Bonds * $16.1
  • Other Liabilities * $13.5
  • Less: Debt Related to Capital Assets * $8
  • Unfunded Pension Benefits * $6.6
  • Unfunded Retirees' Health Care Benefits * $0
  • Bills * $28.2
  • * figures in billions
IN THE NEWS
Financial State of the States 2024

OCTOBER 3, 2024

Our fifteenth annual Financial State of the States (FSOS) report provides a comprehensive analysis of the fiscal health of all 50 states.

VIEW LESS
DATA BY CATEGORY
RECENT DATA UPDATES
Local Government Units in States

For 2022 the U.S. Census Bureau reported the number of local governments in all the states.  As to be expected the smallest states had the fewest local governments.  However, the states with the most local government units were not necessarily the largest. 

Bachelor's Degree Median Income in Cities

For students graduating soon, it might be worth looking at the median income for people with a bachelor's degree only in different cities.  For information about median earnings for men and women by education in the 75 largest cities check out our interactive database at Data.Z.org

TIA DATA & ANALYSIS SERVICES
Custom Analysis

Our proprietary methodology analyzes government financial reports to develop a comprehensive, concise view of state and municipal finances, including all assets as well as pension and retirement health obligations not completely disclosed in financial reports. Learn how we can help you discover the truth about your government's fiscal condition.

Complimentary Downloads
book_img

Download our comprehensive reports on state and municipal finances–including "The Financial State of the States"–for free. Former U.S. Comptroller General David Walker has said, "While other organizations have compared the states' unfunded retirement liabilities, only this report has determined the overall financial condition of every state."

CLICK HERE TO DOWNLOAD OUR LATEST FSOS REPORT (SEPTEMBER 2021)